


Clean electricity in Europe: who's pulling their weight?

News articles about the electricity portfolio of various countries will usually say how much was generated in a given country, and how much of that was low-carbon or just renewable.
For example: “Renewable energy like wind and solar accounted for 59 percent of production in Germany, while in Britain it stood at 45 percent, the data showed.”1
Or: “Utilities in Portugal have cut the proportion of electricity production from fossil fuels to just 10% so far in 2024, leap-frogging neighbour Spain to emerge as western Europe's second-cleanest large power sector behind France.”2
This is nice in terms of pollution abatement, but that’s not enough. It is also important to generate electricity. Otherwise the deficit must be made up with electricity imports; nothing to brag about. The following chart shows which countries are the best at both, by comparing clean generation to internal consumption.

Here we can see that Sweden and Norway stand out by not only producing all the clean electricity they need, they actually manage to export a large surplus. France and Switzerland both export a bit as well. And Iceland is completely self-sustained without any carbon emissions from electricity.
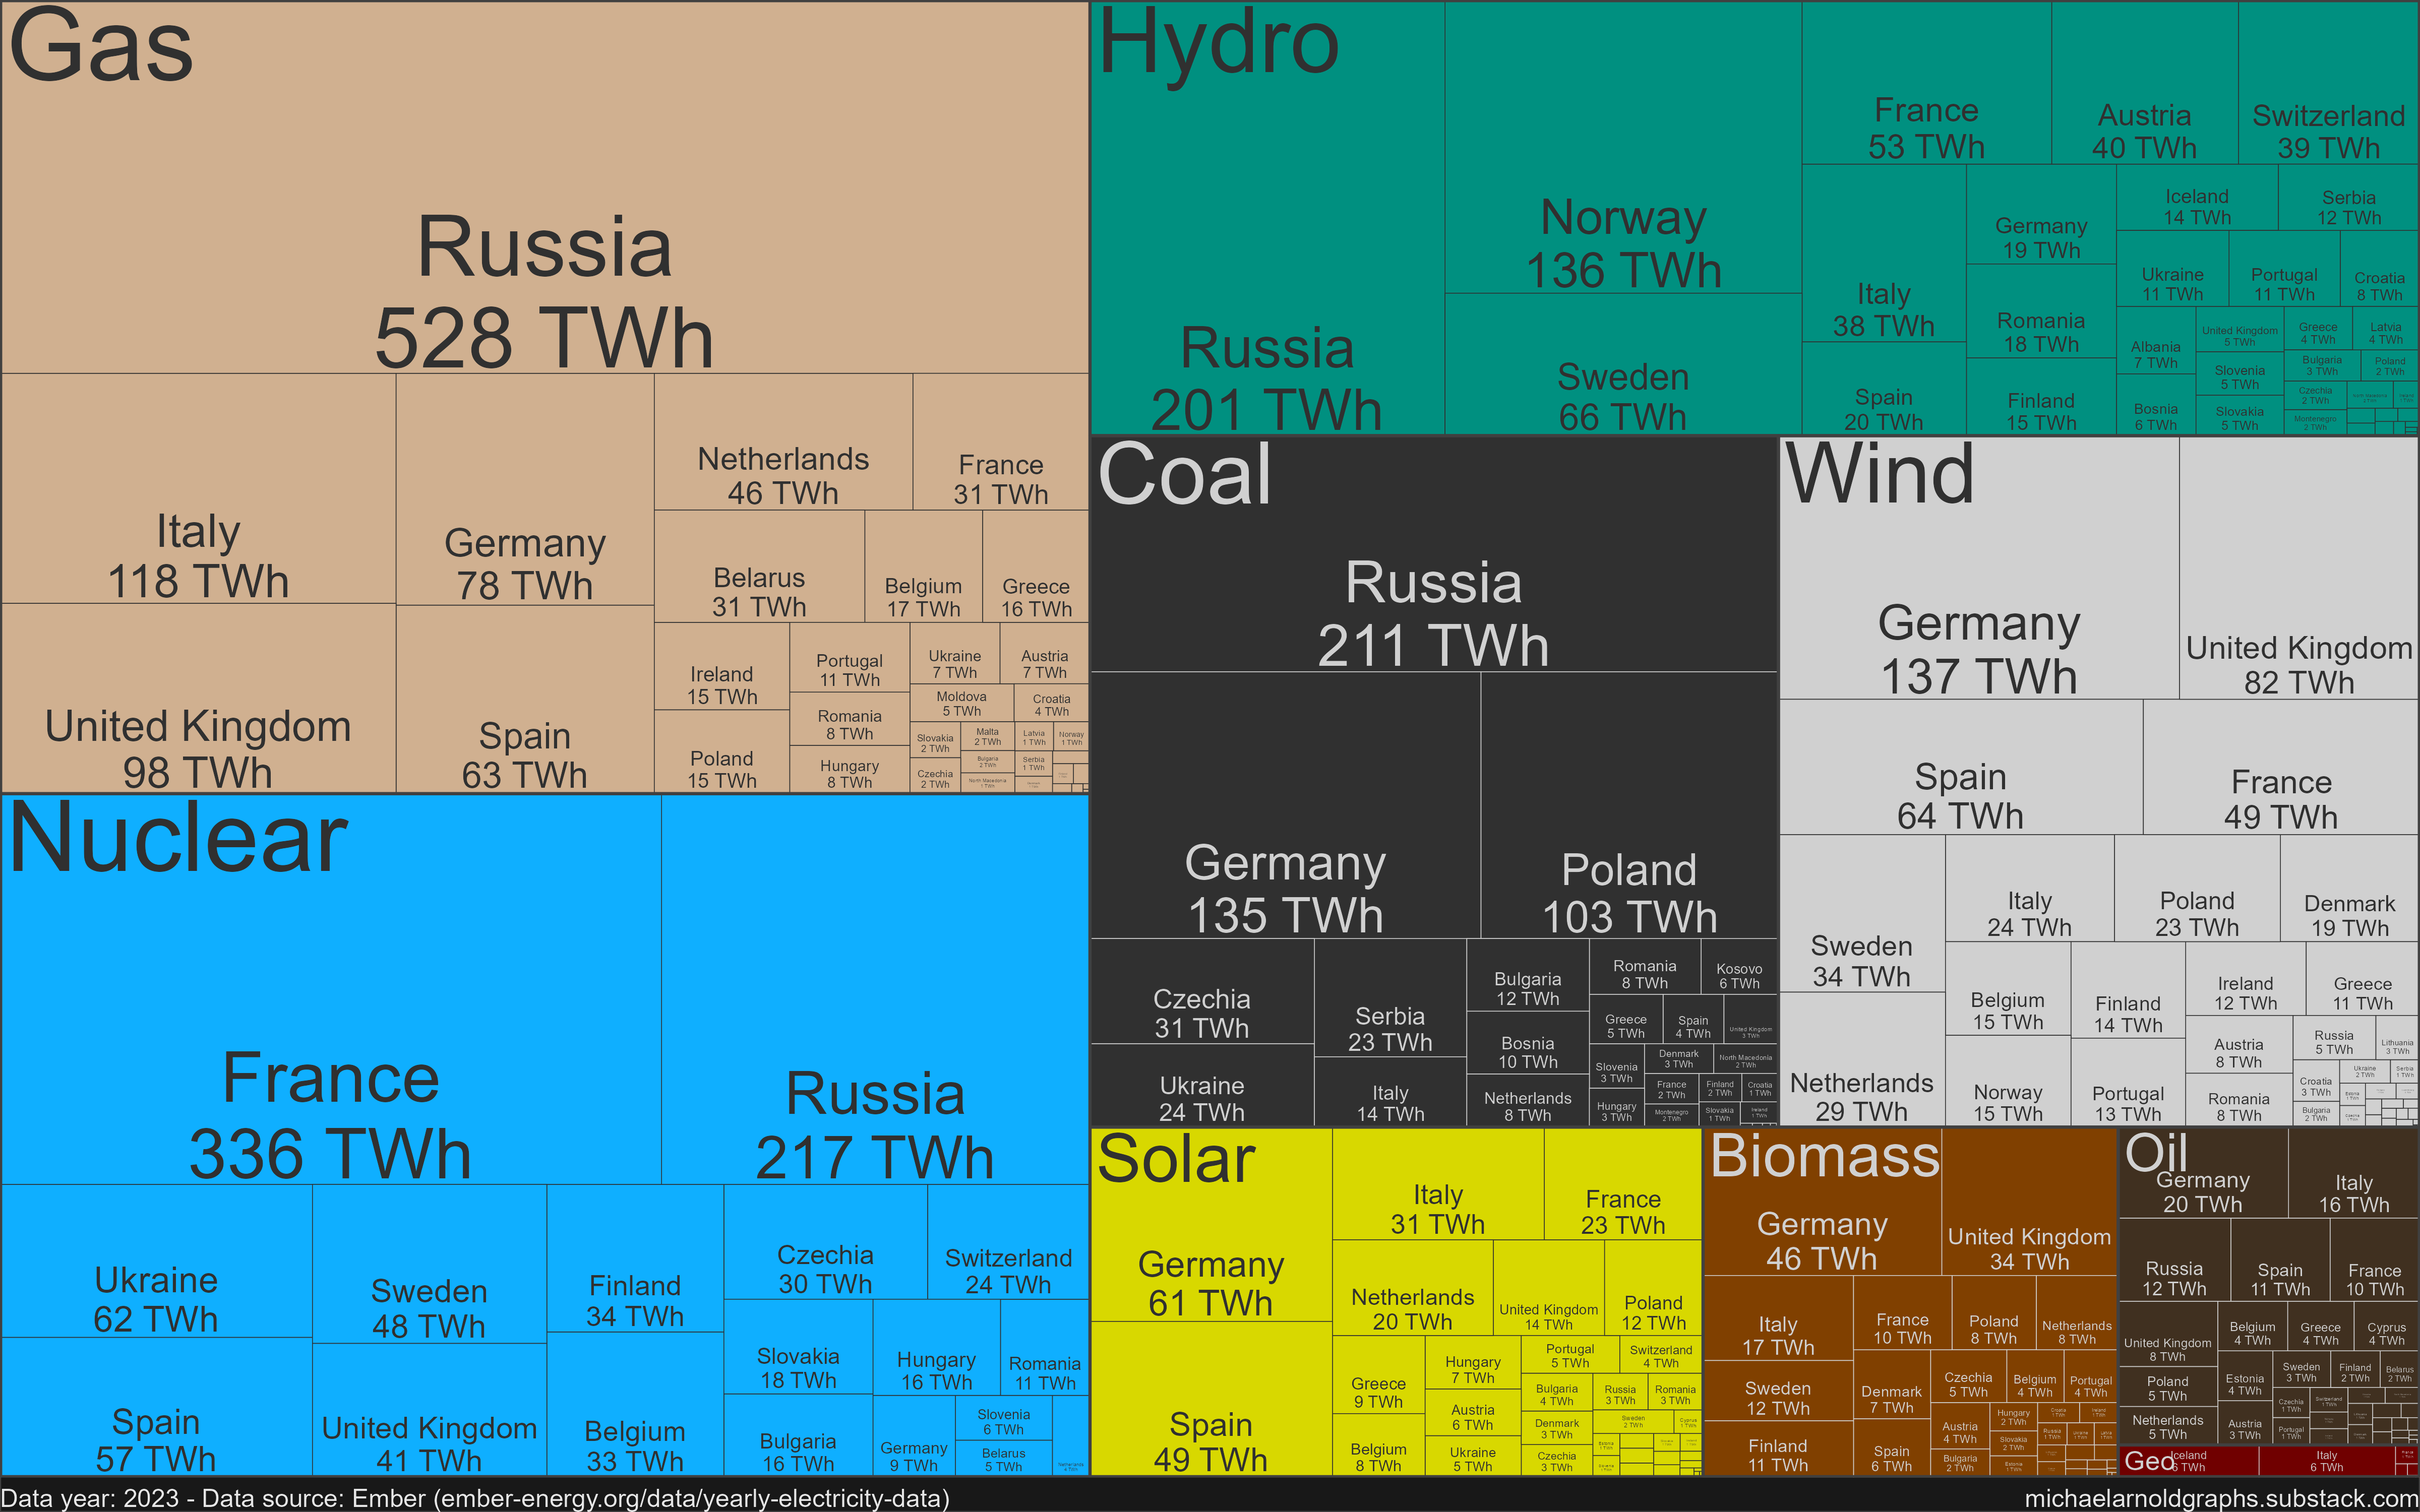
How do Sweden, Norway and France achieve such a high proportion? In 2023, France produced 336 TWh from nuclear, compared to a total of 514 TWh generated and 464 TWh consumed. Norway produced 136 TWh from hydro power, compared to 153 TWh total generated and 136 TWh consumed. Sweden mainly used a mix of hydro (66 TWh) and nuclear (48 TWh) out of a total 166 TWh, and consumed 137 TWh.
There is the old adage: “Be good. If you can’t be good, be lucky”. Well, the Nordic countries have perhaps been lucky and wise enough to build out a lot of hydro. But a few countries in Europe have made their own luck by maintaining sizeable amounts of nuclear. Detractors may have valid criticisms of nuclear, but it is clearly a viable answer when the goal is to reduce pollution.
For additional context, here is a graph of net exports:

This graph has the more conventional metric of clean generation as a percent of total generation:

And this alternative treemap is grouped by countries first and sources second:

https://fortune.com/europe/2025/01/06/renewables-dominate-uk-germany-clean-energy-high-2024/
https://www.reuters.com/business/energy/europes-savvy-new-clean-energy-champion-maguire-2024-08-16/